Christchurch Canterbury and New Zealand Earthquakes.
Christchurch Earthquake Energy Release Graph
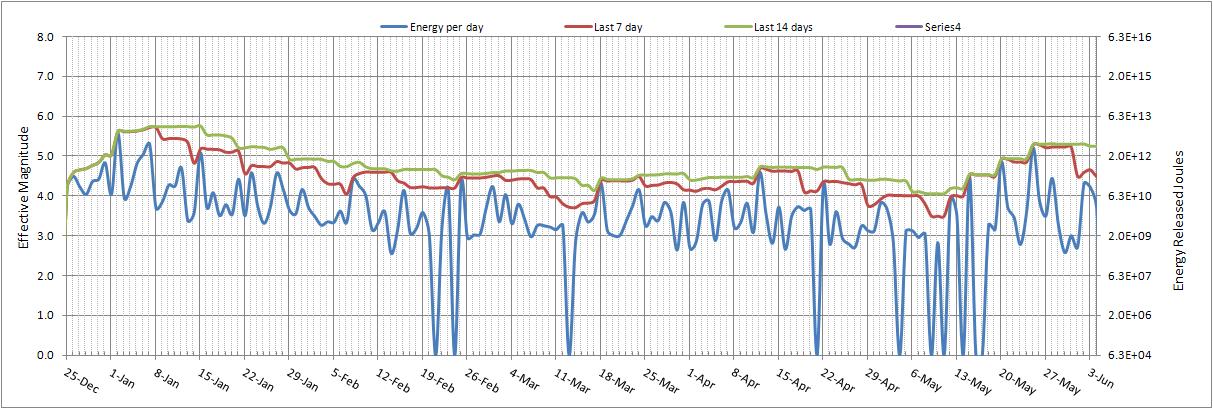
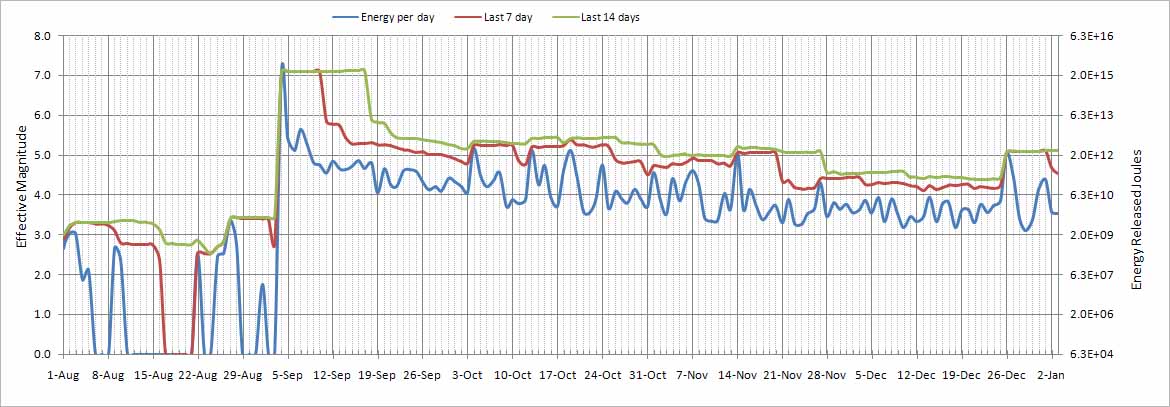
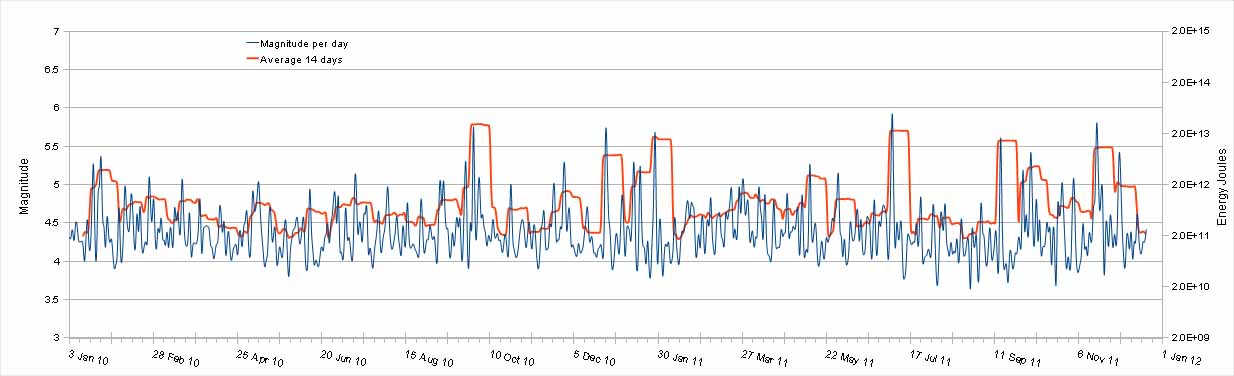
The graph below shows pre and post 4-September Christchurch 7.1 earthquake energy released per day
2012
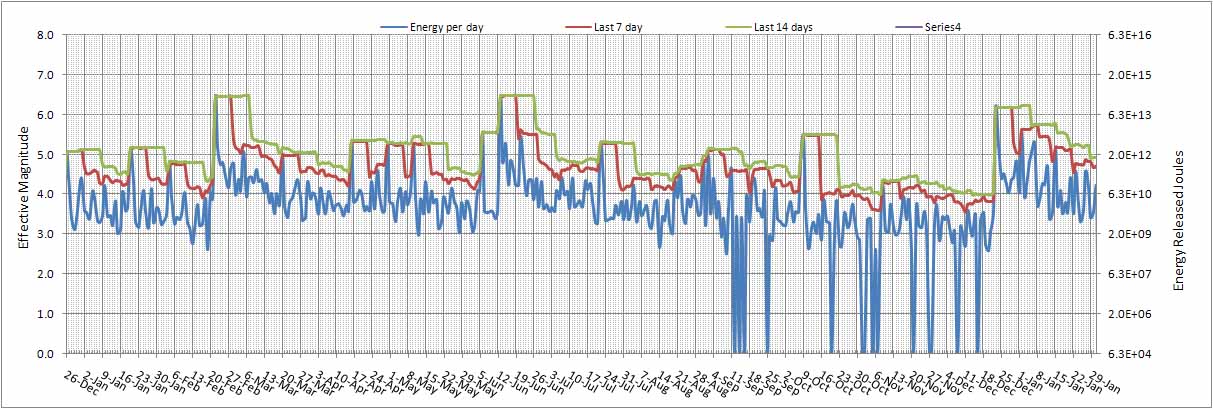
2011
2010
The graph shows the total energy released, each day (blue), last 7 days ( red), last 14 days (green) in Joules right side scale.
The scale in the left is the effective magnitude that would result if the total
energy:
- for that day was release in one earthquake each day
- for the last 7 day was release in one earthquake, one
every 7 days
- for the last 14 day was release in one earthquake, one
every14 days
FootNote:
The 7.1 magnitude quake released 2.8E+15 Joules, which is about the energy used
by 100,000 houses in a year. ( about the size of Christchurch)
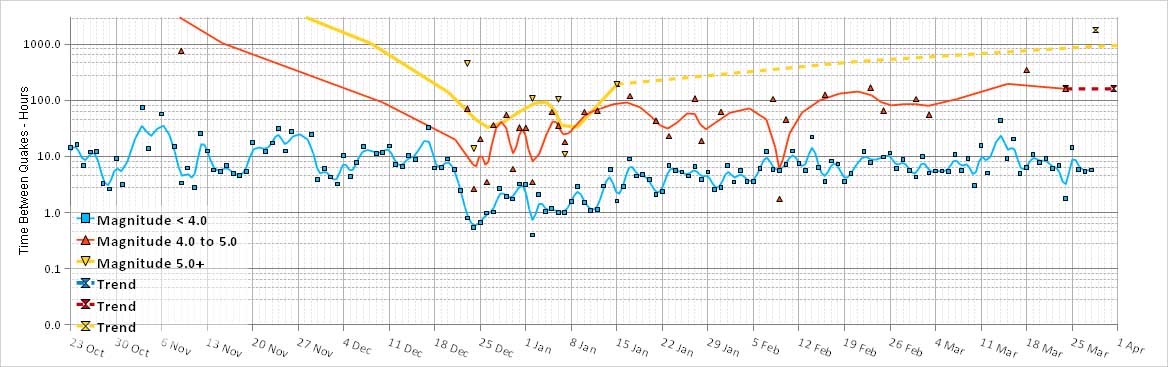
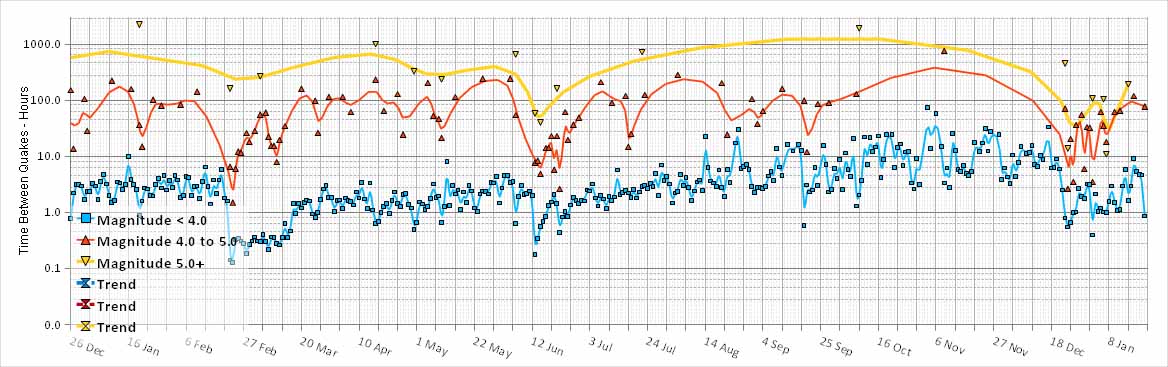
Time Between Earthquakes In Canterbury
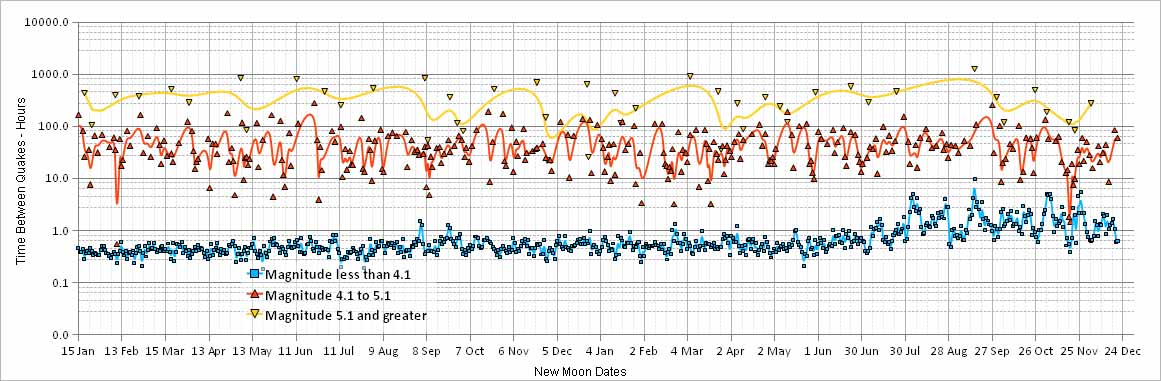
The graph below shows the average times between quakes in hours - of magnitudes
Less then 4 (Blue)
From 4 to 5 (Red)
Greater Than 5 (Yellow)
2012
2011
2010
This is probably the cycle time of this fault and Canterbury geography. The
time it takes to settle then build up stress, to its main breaking point.
As time goes on with the ground settels down and the breaks start to fuse together, this cycle time should lengthen.
The above graph shows this for 2010 and 2011. The sequence time starts from the 4
Sep 2010 quake, and is shown centred on this date.
The observation is only intended to be taken as valid during the Canterbury earthquake activity.
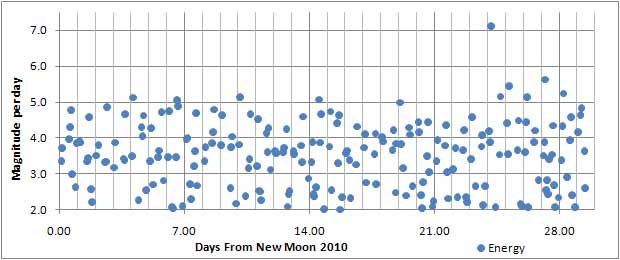
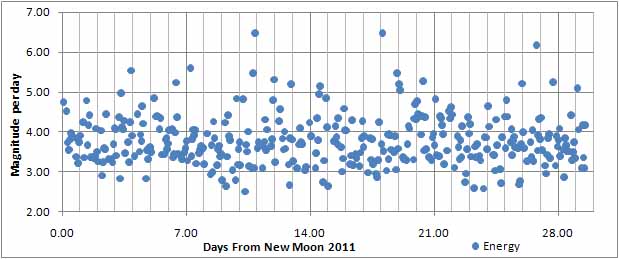
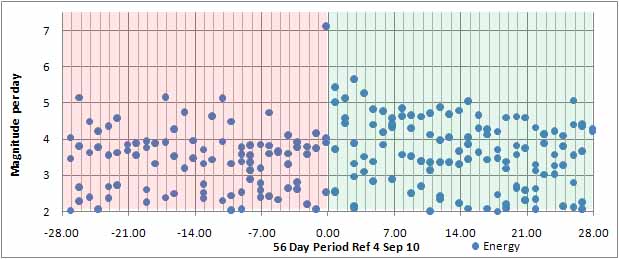
The above graph shows the earthquakes and the energy released each day during the 29.5 day lunar cycle over a year for Canterbury
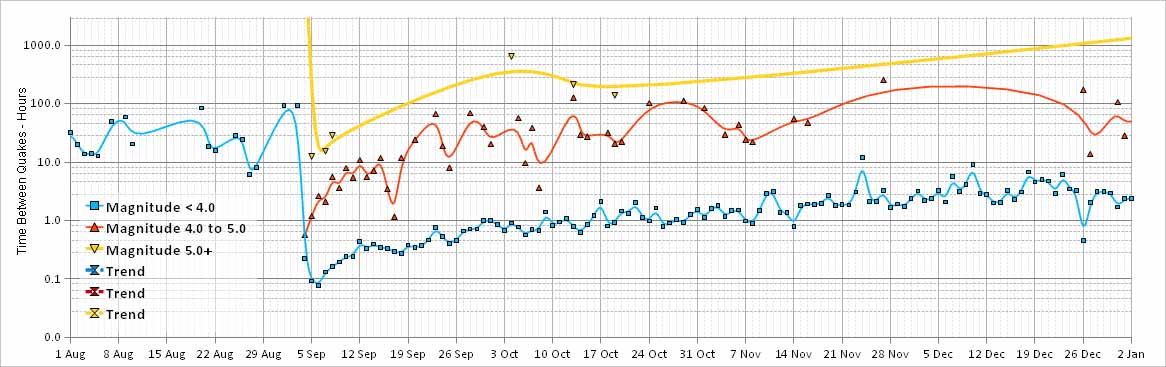
Time Between Earthquakes around New Zealand
The graph below shows the duration between quakes around New Zealand during the year, excluding the Canterbury / Christchurch area due to the 7.1 earthquake on 4 September 2010.
The major grid spacing is 29.5 days which is the orbit time of the moon. The graph
shows the correlation between the earthquake separations and moon orbit. The mid
magnitude range 4.1 to 5.1 seems to show a slight increase in earthquake activity
about every 29.5 days but is not consistent. 5+ magnitude seems to be about 2 per
month and on average a small bias being about 9 days before new moon. The spread
of peek quake magnitudes is only about one magnitude across the new moon cycle.
(see graph below)
From this data there is no consistent way of predicting when an earthquake is going
to happen and at what magnitude. This data is also New Zealand wide, and could be
anywhere and at any depth.
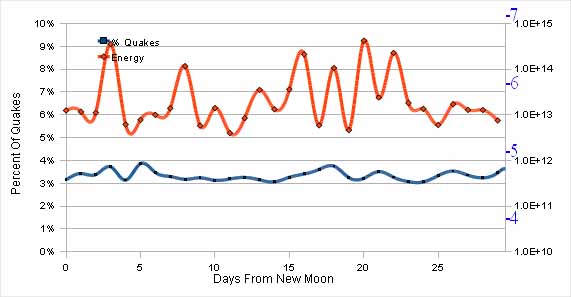
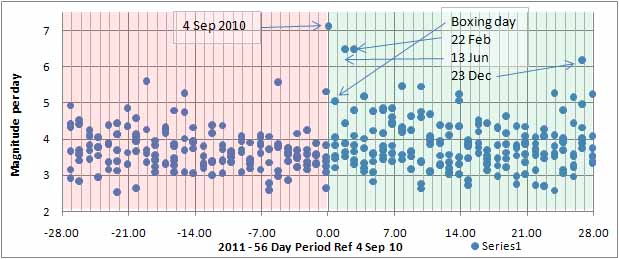
The above graph shows the percentage of earthquakes and the energy released each day during the 29.5 day lunar cycle over a year for New Zealand